These indicators are related to state of San Paulo Convid19 pandemic data up to 22/03/2021.
This information is for own use only and shall NOT be used for medical and public policy guidances.
| 15/03/2021 | 22/03/2021 | variations | |
|---|---|---|---|
| cases | 2207863 | 2297662 | 89799 (4%) |
| deaths | 64223 | 67414 | 3191 (4%) |
| contaminated cities | 645 (100%) | 645 (100%) | 0 (0%) |
Moving average over last 7 days.
Move the mouse over the map for each region details.
Moving average over last 7 days.
Move the mouse over the map for each region details.
Plus: Santa Gertrudes, Rio Claro, Cordeirópolis, Limeira, Lucélia, Adamantina
This ranking is made from the total of deaths per each thousand of population of each city of the state.
| city | date | day | population | case_day | cases | death_day | deaths | cases_thousand | deaths_thousand | perc_death | |
|---|---|---|---|---|---|---|---|---|---|---|---|
| 1 | Parisi | 2021-03-20 | 312 | 2161 | 9 | 227 | 1 | 13 | 105,044 | 6,016 | 5,73 |
| 2 | Santa Clara d'Oeste | 2021-03-20 | 297 | 2115 | 1 | 122 | 0 | 8 | 57,683 | 3,783 | 6,56 |
| 3 | Bálsamo | 2021-03-20 | 291 | 9068 | 1 | 959 | 0 | 32 | 105,757 | 3,529 | 3,34 |
| 4 | Cosmorama | 2021-03-20 | 312 | 7307 | 5 | 445 | 0 | 24 | 60,901 | 3,285 | 5,39 |
| 5 | Meridiano | 2021-03-20 | 302 | 3836 | 3 | 216 | 0 | 12 | 56,309 | 3,128 | 5,56 |
| 183 | Cordeirópolis | 2021-03-20 | 316 | 24528 | 41 | 2731 | 0 | 33 | 111,342 | 1,345 | 1,21 |
| 209 | Adamantina | 2021-03-20 | 334 | 35068 | 17 | 1737 | 0 | 45 | 49,532 | 1,283 | 2,59 |
| 240 | Rio Claro | 2021-03-20 | 344 | 206424 | 36 | 7478 | 11 | 254 | 36,226 | 1,230 | 3,40 |
| 275 | Limeira | 2021-03-20 | 339 | 306114 | 10 | 14408 | 0 | 351 | 47,067 | 1,147 | 2,44 |
| 287 | Santa Gertrudes | 2021-03-20 | 324 | 26898 | 8 | 1663 | 1 | 30 | 61,826 | 1,115 | 1,80 |
| 376 | Lucélia | 2021-03-20 | 317 | 21747 | 3 | 571 | 0 | 20 | 26,256 | 0,920 | 3,50 |
Plus: Santa Gertrudes, Rio Claro, Cordeirópolis, Limeira, Lucélia, Adamantina
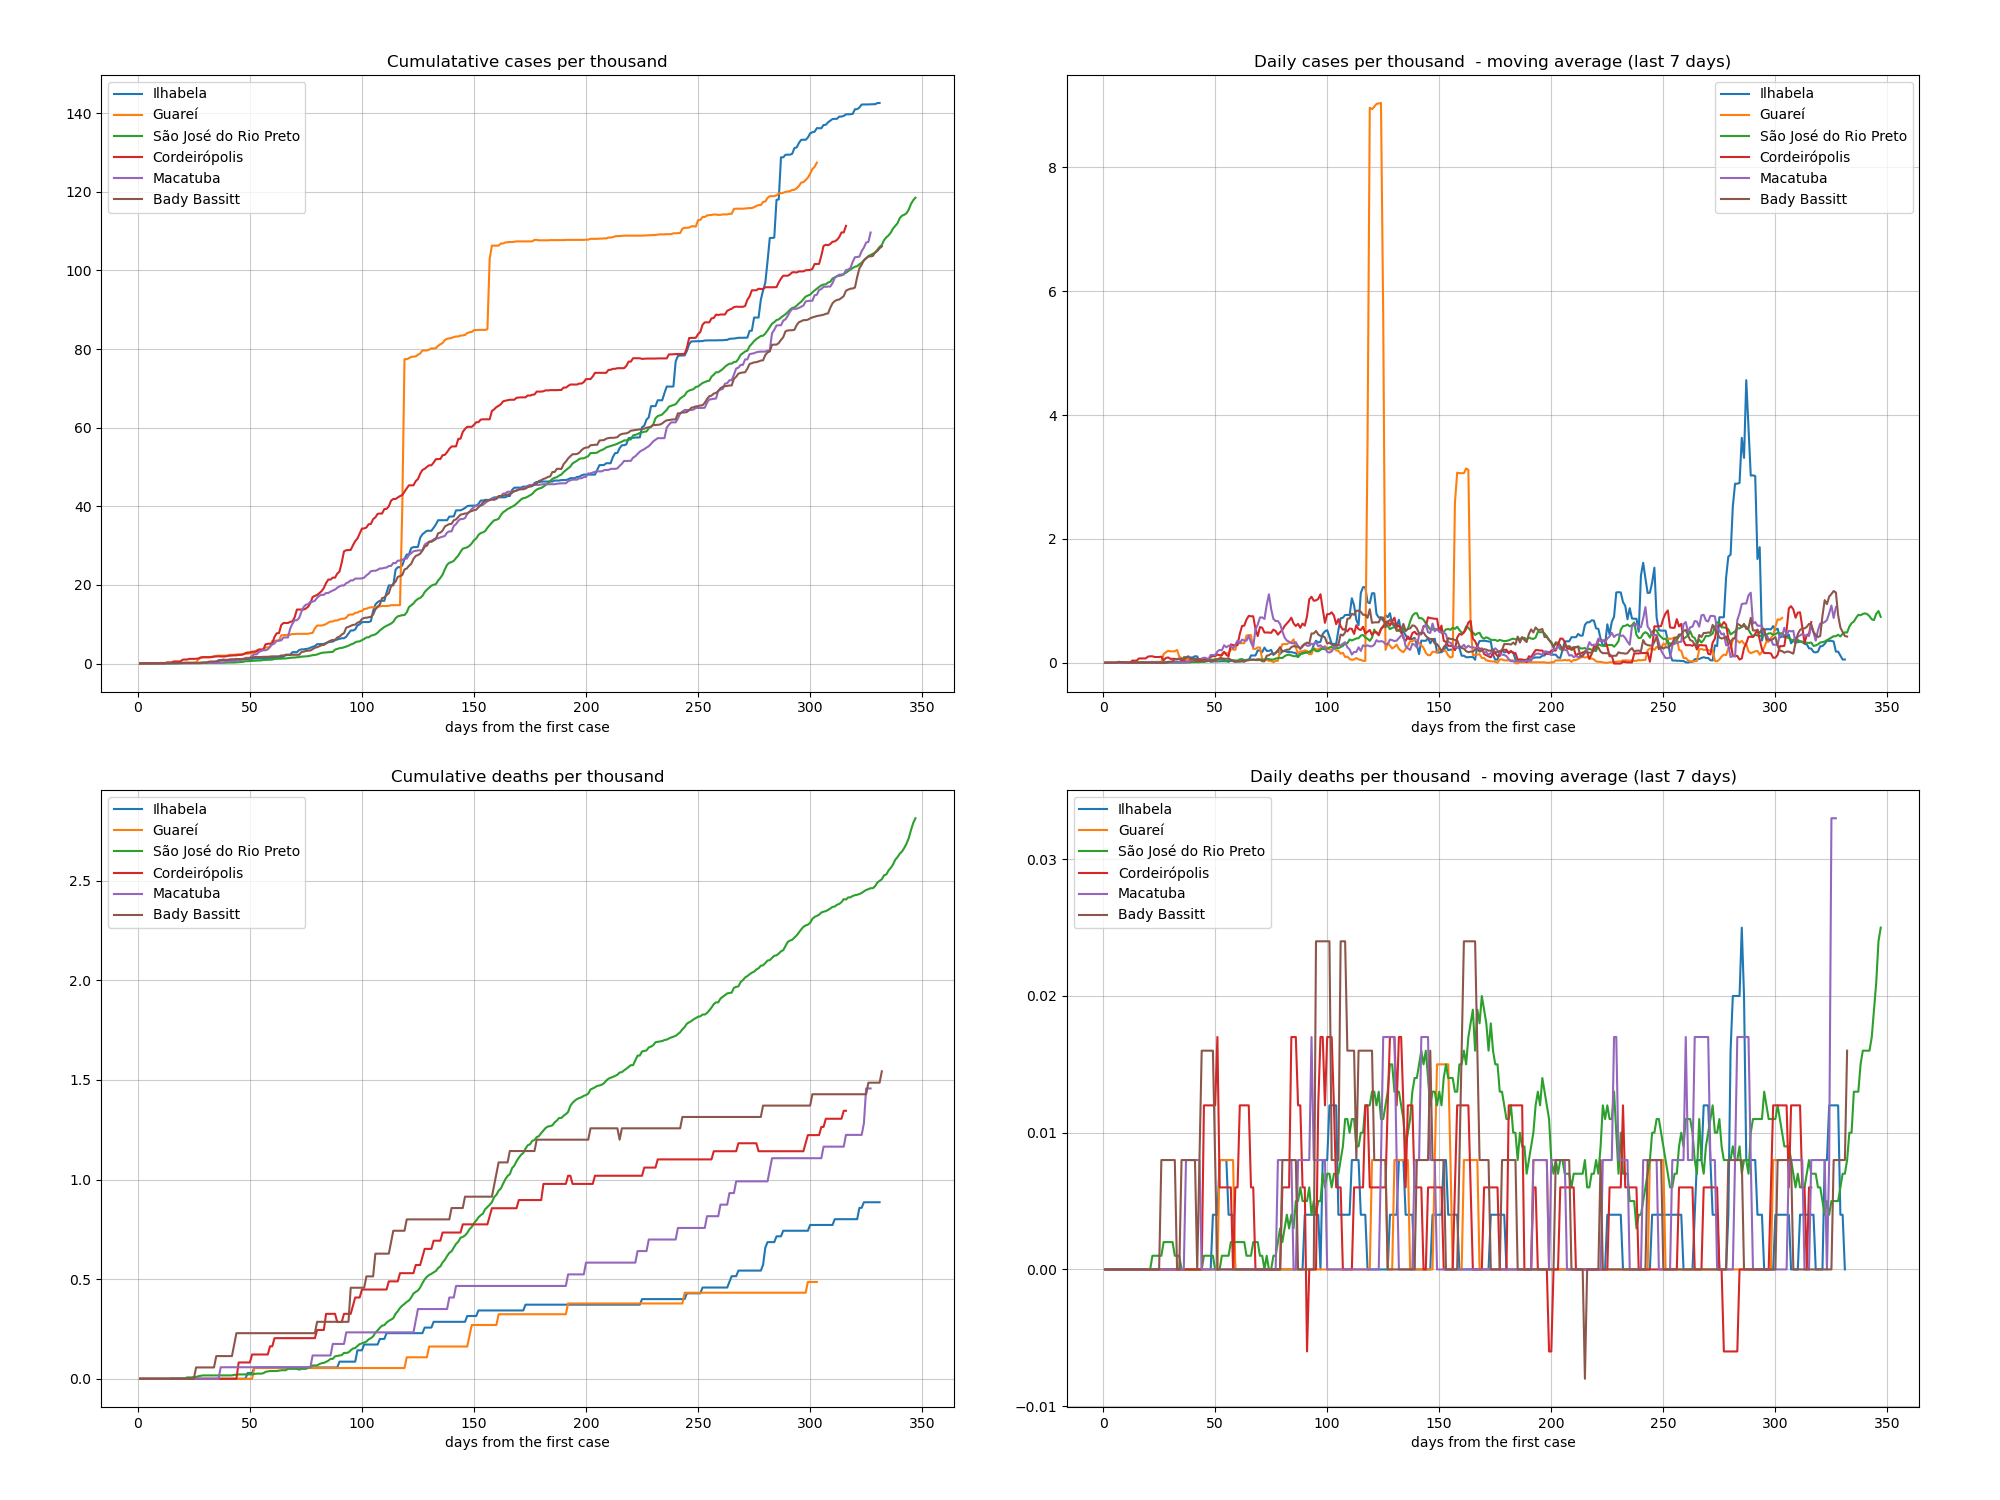
This ranking is made from the total of cases per each thousand of population of each city of the state.
| city | date | day | population | case_day | cases | death_day | deaths | cases_thousand | deaths_thousand | perc_death | |
|---|---|---|---|---|---|---|---|---|---|---|---|
| 1 | Ilhabela | 2021-03-20 | 331 | 34970 | 1 | 4987 | 0 | 31 | 142,608 | 0,886 | 0,62 |
| 2 | Guareí | 2021-03-20 | 303 | 18520 | 20 | 2360 | 0 | 9 | 127,430 | 0,486 | 0,38 |
| 3 | São José do Rio Preto | 2021-03-20 | 347 | 460671 | 301 | 54596 | 11 | 1296 | 118,514 | 2,813 | 2,37 |
| 4 | Cordeirópolis | 2021-03-20 | 316 | 24528 | 41 | 2731 | 0 | 33 | 111,342 | 1,345 | 1,21 |
| 5 | Macatuba | 2021-03-20 | 327 | 17163 | 41 | 1882 | 0 | 25 | 109,654 | 1,457 | 1,33 |
| 6 | Bady Bassitt | 2021-03-20 | 332 | 17502 | 8 | 1857 | 1 | 27 | 106,102 | 1,543 | 1,45 |
| 4 | Cordeirópolis | 2021-03-20 | 316 | 24528 | 41 | 2731 | 0 | 33 | 111,342 | 1,345 | 1,21 |
| 87 | Santa Gertrudes | 2021-03-20 | 324 | 26898 | 8 | 1663 | 1 | 30 | 61,826 | 1,115 | 1,80 |
| 176 | Adamantina | 2021-03-20 | 334 | 35068 | 17 | 1737 | 0 | 45 | 49,532 | 1,283 | 2,59 |
| 195 | Limeira | 2021-03-20 | 339 | 306114 | 10 | 14408 | 0 | 351 | 47,067 | 1,147 | 2,44 |
| 295 | Rio Claro | 2021-03-20 | 344 | 206424 | 36 | 7478 | 11 | 254 | 36,226 | 1,230 | 3,40 |
| 349 | Lucélia | 2021-03-20 | 317 | 21747 | 3 | 571 | 0 | 20 | 26,256 | 0,920 | 3,50 |
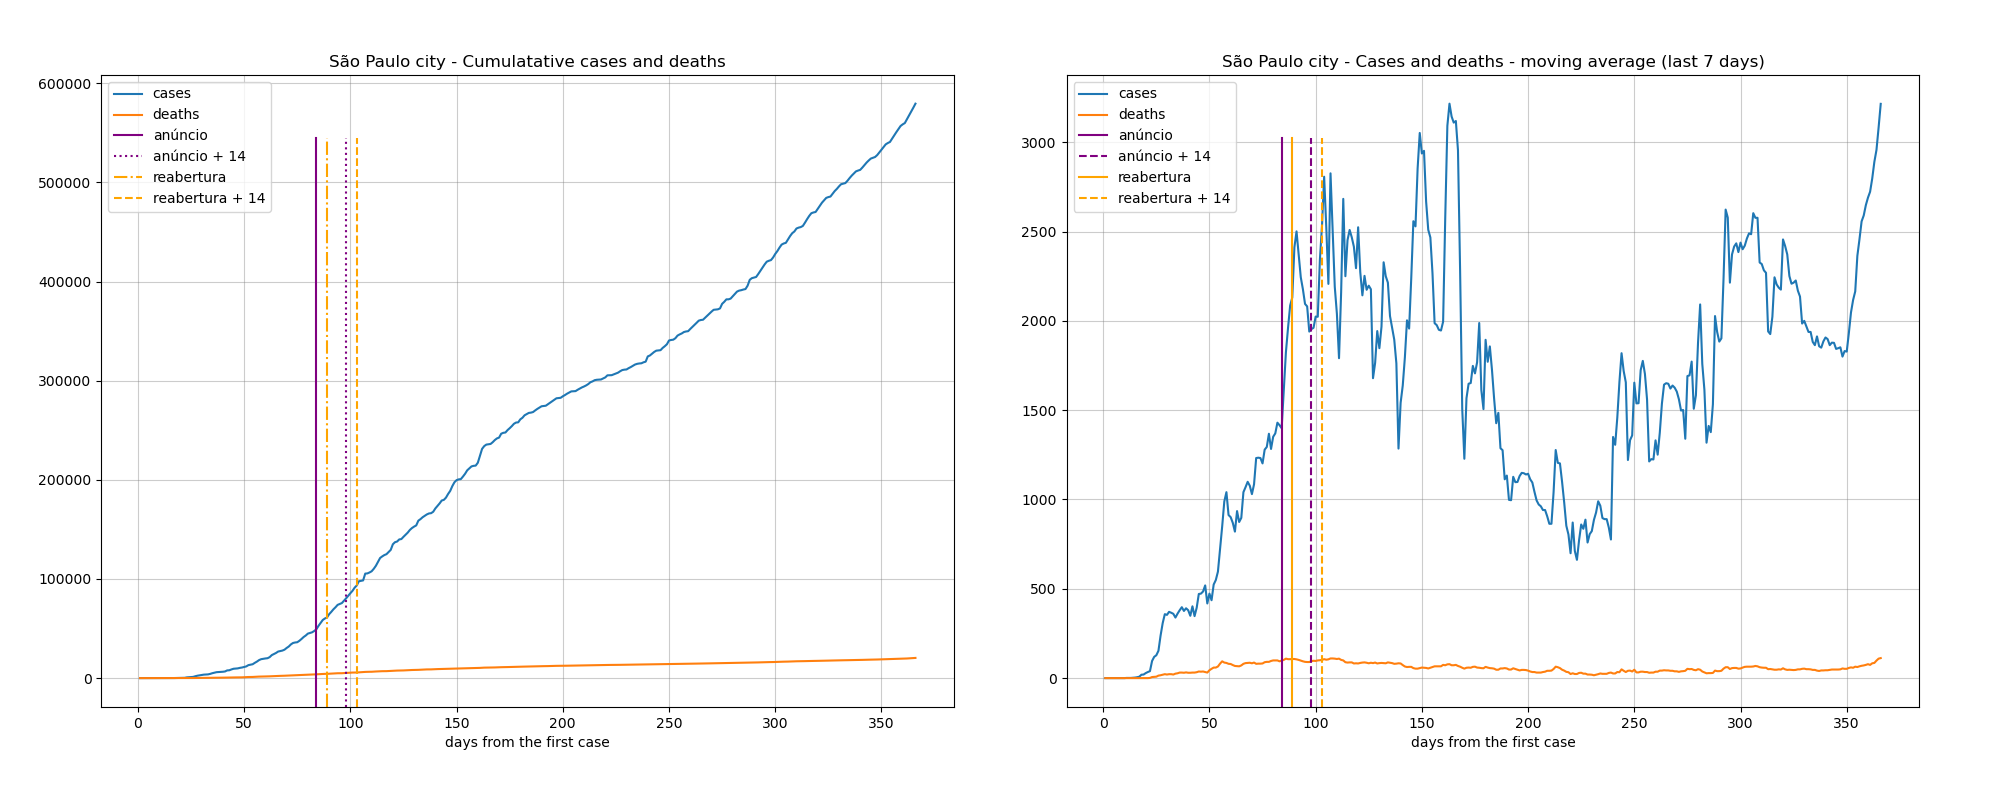
These data of San Paulo city are too high than the other cities, so we plot them in a separed chart.

Excluded San Paulo city
Most transmissible cities with population higher than 10,000.

